List Correlation
This action computes the correlation coefficient, which measures the strength and direction of a linear relationship between two lists of continuous…
This action computes the correlation coefficient, which measures the strength and direction of a linear relationship between two lists of continuous numerical data.
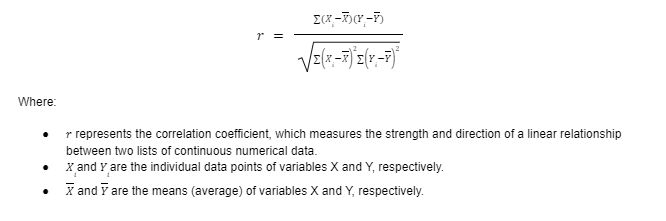
The List Correlation action uses the Pearson Correlation Coefficient formula:
Inputs & Outputs
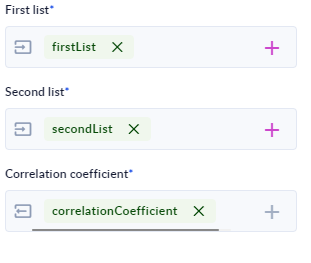
- [ I ] First list and Second list: Double (List) representing data points for calculating the correlation coefficien. Each list should contain the same number of data points, and the data points should be continuous numerical values.
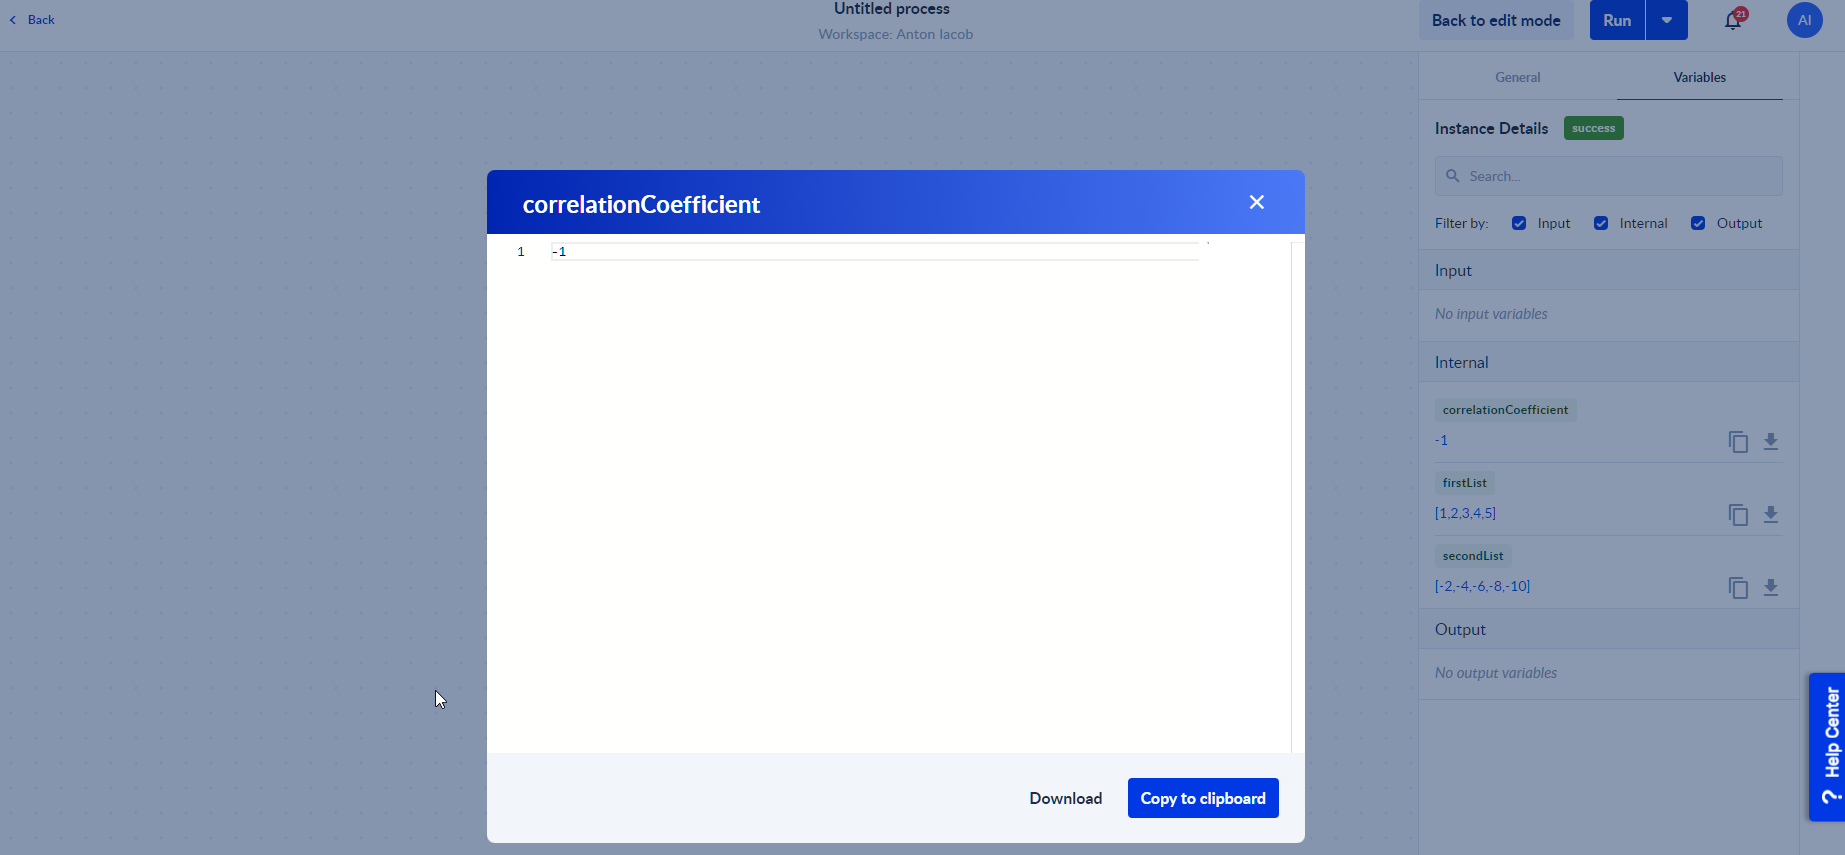
- [ O ] Correlation coefficient: Double (List) representing a single numerical value between -1 and +1 that represents the strength and direction of the linear relationship between the input lists.
Example Usage
- Drag the List Correlation action from the Community-Made folder to the canvas.

- Declare the variables to be used with the List Correlation action.
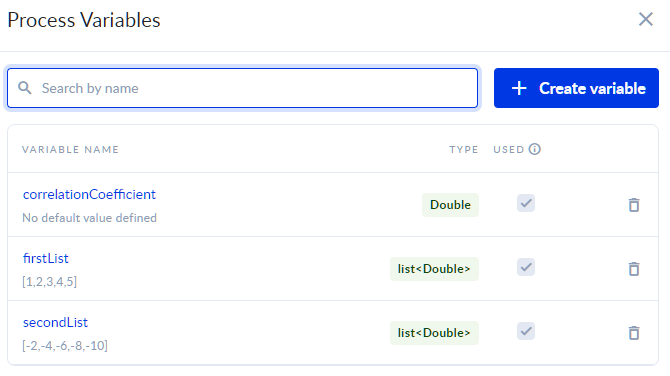
- Assign the newly created variables.
- Save & Run the process and then Check Instance to see the output.
Use Cases
- List Correlation can be used to examine the correlation between income and education level, temperature and ice cream sales, customer satisfaction and repeat purchases etc.
Creator
- Franck - The Productivity Lab